Introduction
Welcome to to the PapyriAR user guide. This is the right place to start your journey if you want to use this project. This introduction should serve as a first insight into the project and provide useful information on how to use the visualizations, created through this project. The next chapters will provide a more detailed description for not only using, but also creating your own visualization for papyri from the Heidelberger Gesamtverzeichnis der griechischen Papyrusurkunden Ägyptens (HGV).
How do PapyriAR visualizations look like?
A visualization should look something like this:
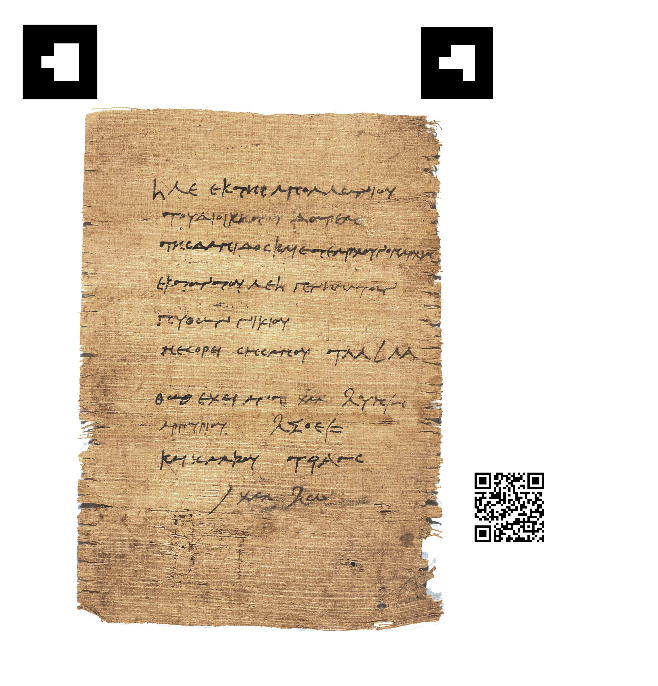
The image of "Resoconto di derrate" is licensed by the Heidelberger Gesamtverzeichnis der griechischen Papyrusurkunden Ägyptens under CC BY 3.0.
By default the visualization will display some basic information about the visualized papyrus. This includes title, material of the document, some tags describing the context of the papyrus and the place and time of creation. It will look something like this:
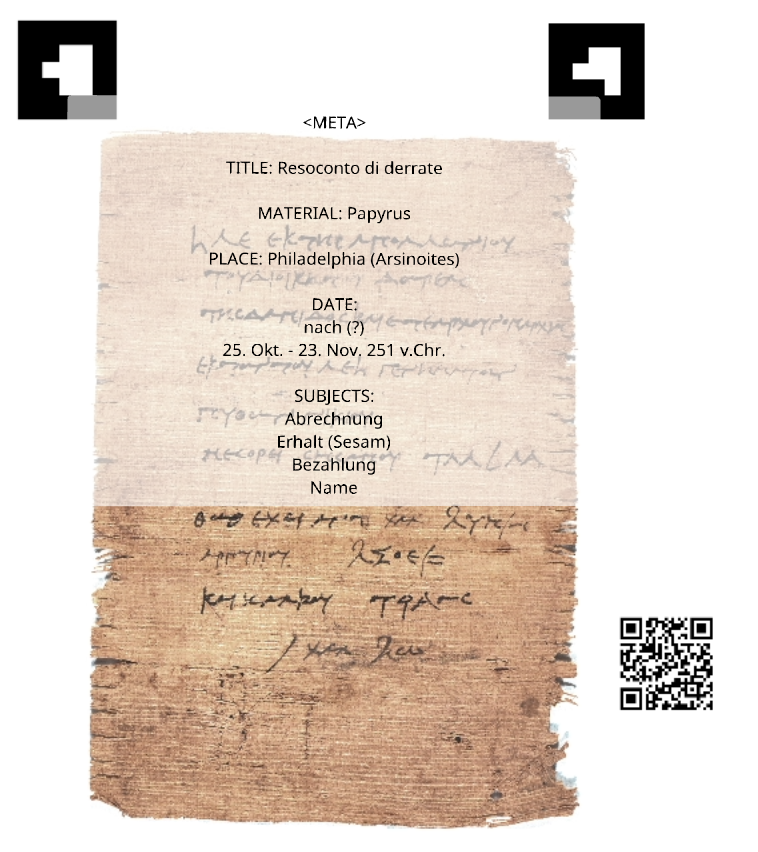
The image of "Resoconto di derrate" is licensed by the Heidelberger Gesamtverzeichnis der griechischen Papyrusurkunden Ägyptens under CC BY 3.0.
The visualization can also display transcriptions from the Duke Databank of Documentary Papyri (DDbDP). To overlay these transcripts correctly over the papyrus, eScriptorium data is used. This will look something like this:
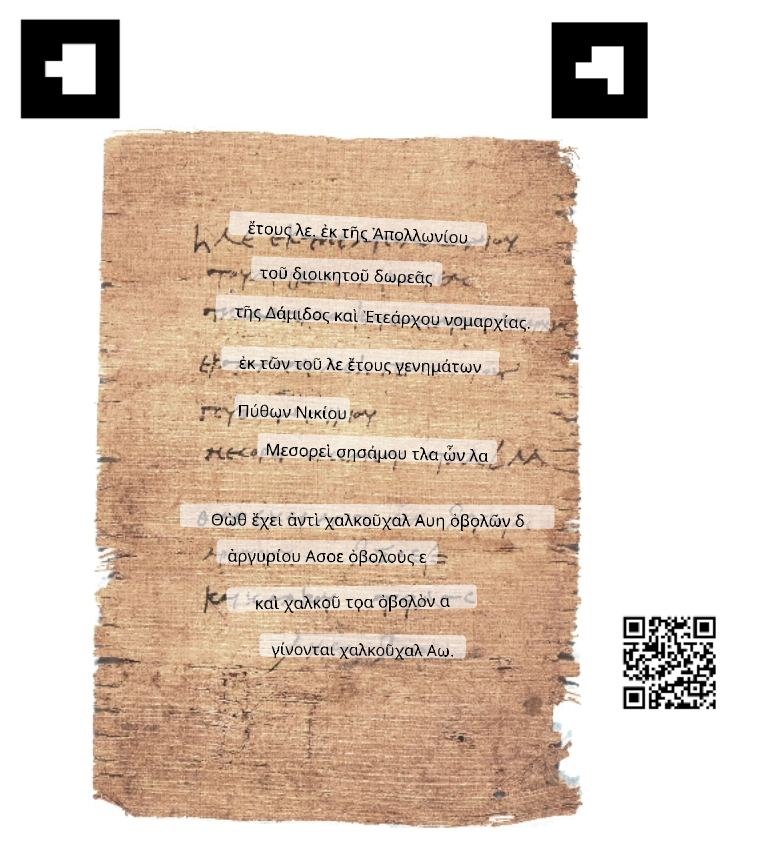
The image of "Resoconto di derrate" is licensed by the Heidelberger Gesamtverzeichnis der griechischen Papyrusurkunden Ägyptens under CC BY 3.0.
Components of the visualization
Everything needed to use a PapyriAR visualization is a mobile device with a camera and an internet connection. Beyond that, every thing should get provided py the visualization itself. For this, every visualization consists of three main components. We will provide a quick explanation of the individual components here. If you want an in depth description on how they work, please head to the Developer Guide.
QR-Code
Every visualization has a QR-Code, which needs to be created separately for every Papyrus you want to visualize. It encodes all the information about the papyrus, which can't be fetched at runtime. On scanning the Code, it will redirect you to the main PapyriAR web page, providing the encoded data. If you want to create your own visualization, look into generating QR-Codes.

Marker
Visualizations also consist of two markers, that don't hold any information. As a result, these stay constant between different papyri. They are used by the AR framework to track the papyrus in 3D space. This is essential for displaying any data in the augmented reality. Beyond this, the two markers serve different purposes respectively.
Marker 1
The first marker is used as the anchor for the data in the scene. All elements will be displayed relative to the position of this marker. It is important for this marker to always stay visible.

Marker 2
The second marker only works in combination with the first marker. If both of them are visible to the camera, This marker will trigger the page to recompute the distance between the two markers. This distance is then used to realign the scalings of the data displayed, such that it fits the papyrus underneath it.
